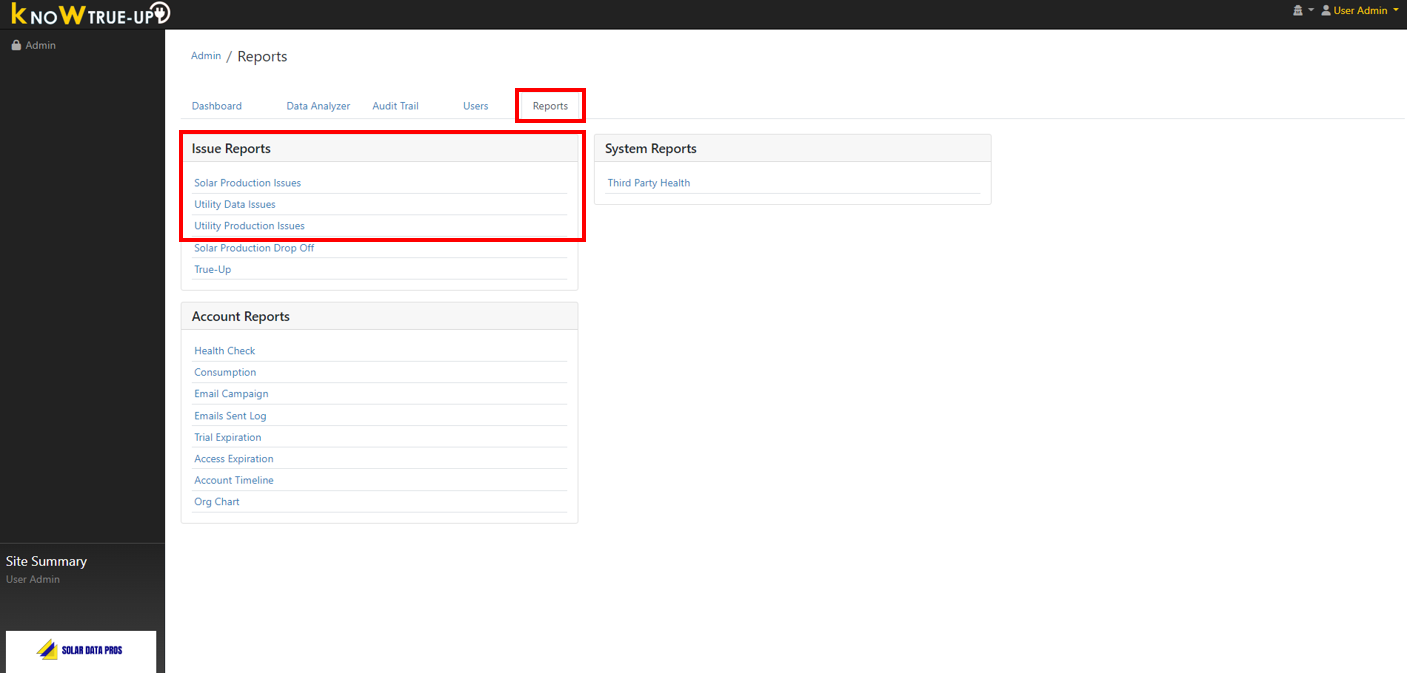
Know True-Up automatically runs the first 3 issue reports everyday and sends them to an email or group of emails defined for your company profile. If you need to change or add to the emails which receive these automated reports, please contact Solar Data Pros. We will take a deep dive into each report below.
Solar Production Issues
Utility Production Issues
Utility Data Issues
Solar Production Issues
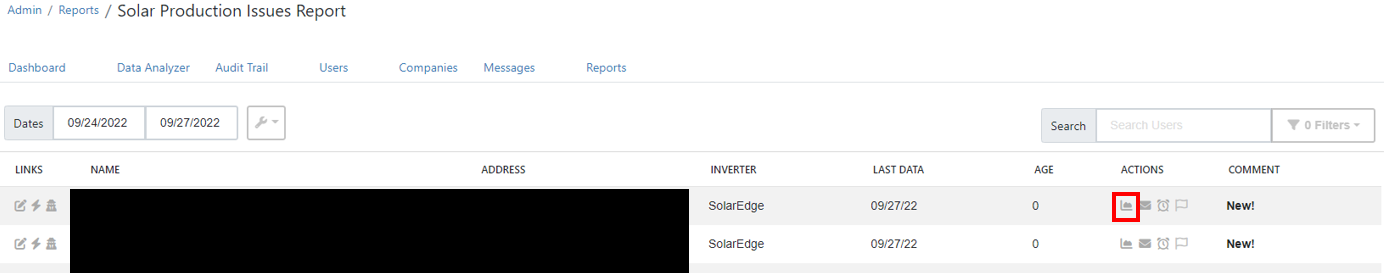
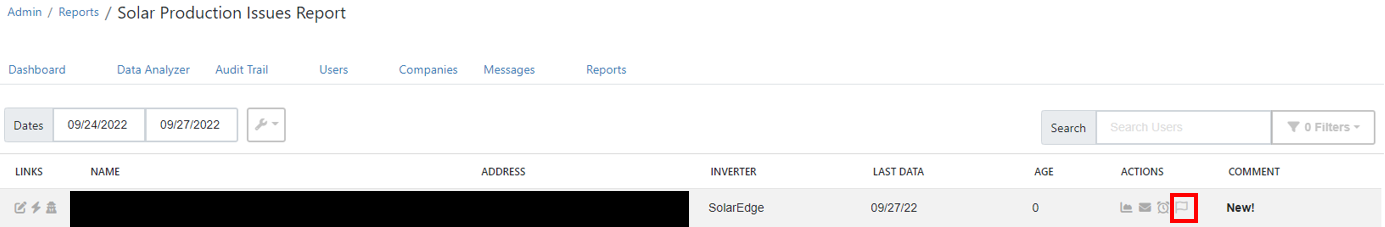
This report generates a list of systems which have a solar inverter data connection and generated 0 Kwh Production. The default view is the last 72 hours, but can be updated by changing the dates in the "Dates" range.
1. Click the "Show Graph" button to view the user graphs
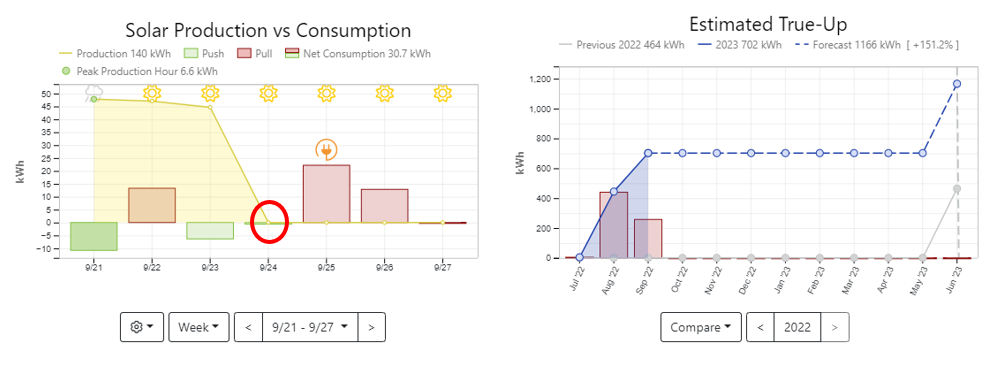
2a. For systems with both a Solar Inverter data connection and Utility Data Connection, you will see both graphs below. Identify the day when Solar Production is flagged as 0 Kwh for further investigation.
2b. For accounts with only a Solar Inverter data connection you will only see the Solar Production Chart Below. In this case you will need to contact the system owner or visit the site to determine the cause of the issue.
Note: Getting the customer's utility account connected remotely can be done to allow you further diagnostic capability without traveling to the site. See Connecting Utility or Inverter Data for a Customer for details on this process.
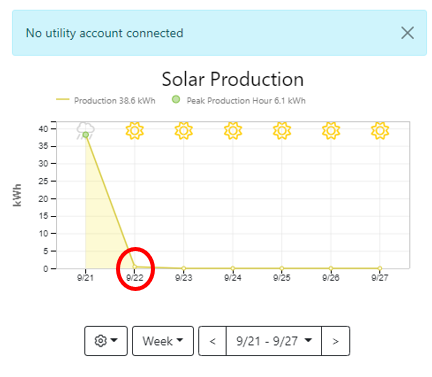
3. Click on the net consumption bar for the day showing 0 kwh production to take you to the individual day view
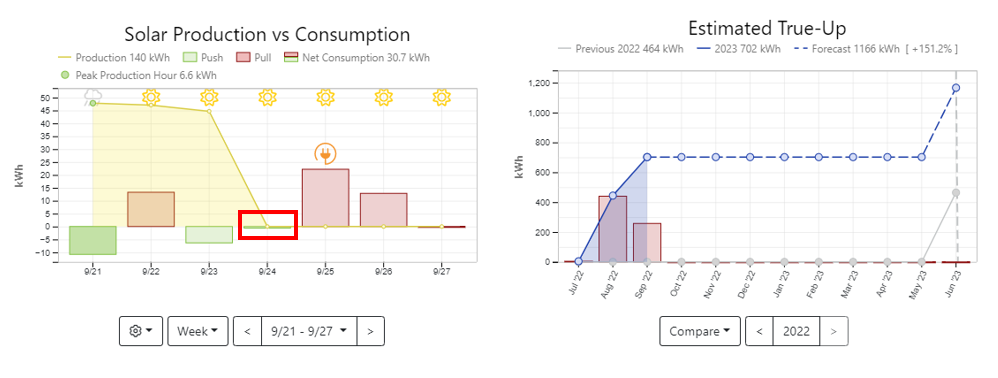
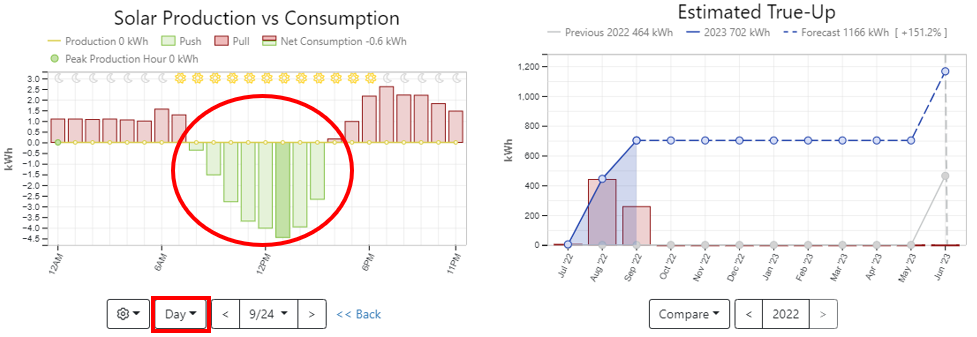
4a. In this example in the day view, we see push to the utility (green bars) indicating the solar system is producing even though the solar data connection is showing no production (yellow line). This indicates a likely communications issue with the inverter.
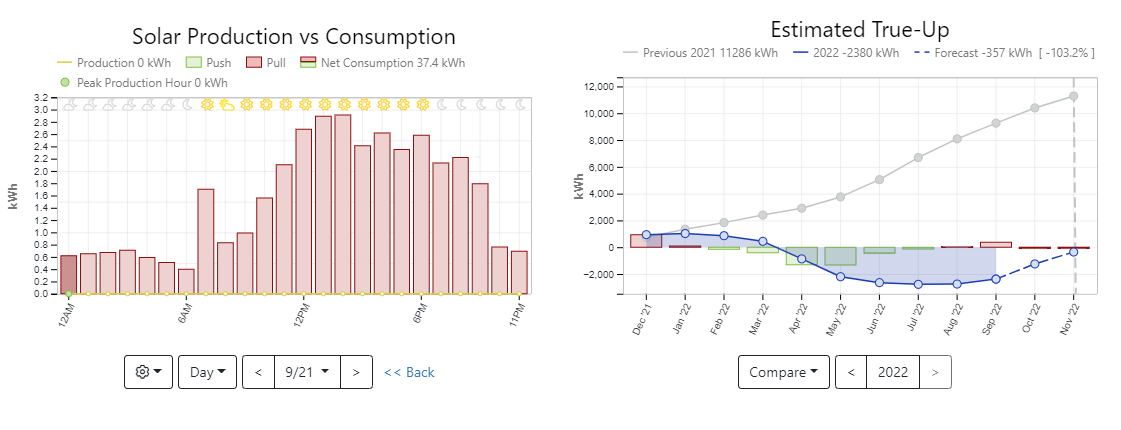
4b. In this example in the day view, we see no green bars/push to the utility. Since this confirms there is no production via both the solar inverter and utility data connections, this system is not generating power and requires service.
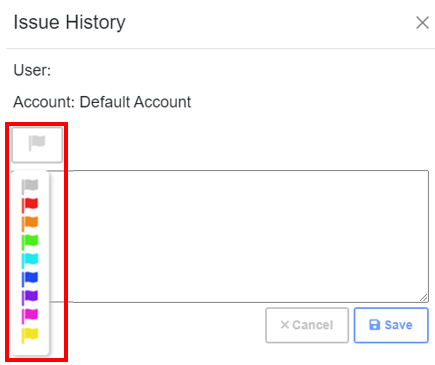
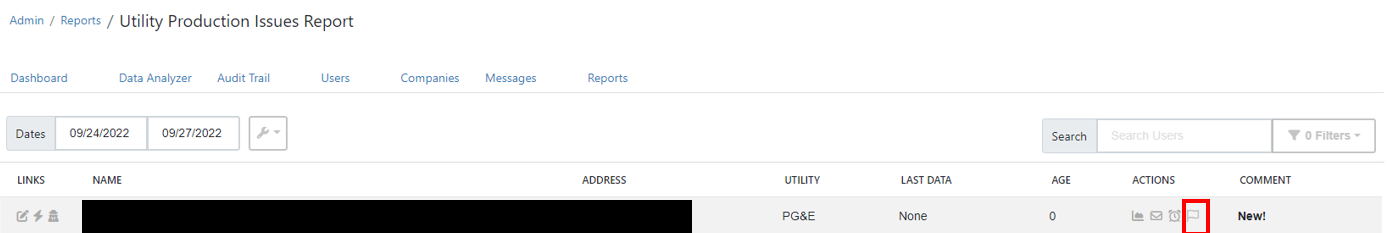
5. Once you have determined the next steps of the issue, it is helpful for your internal tracking purposes to add a note to the system via the "Show Issue" Icon on the report page.
Utility Production Issues
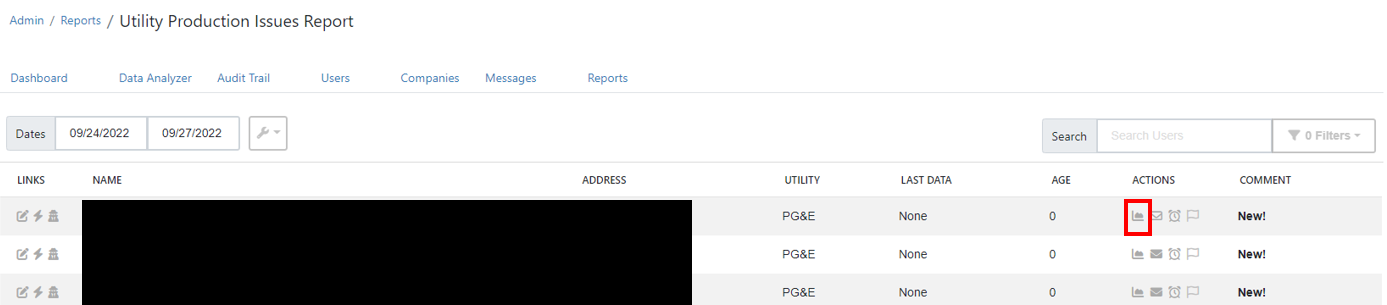
This reports generates a list of systems which do not have a solar inverter data connection only a Utility data connection, and which Know True-Up estimates 0kwh solar production based on the utility data. The default view is the last 72 hours, but can be updated by changing the dates in the "Dates" range.
1. Click the "Show Graph" button to view the user graphs
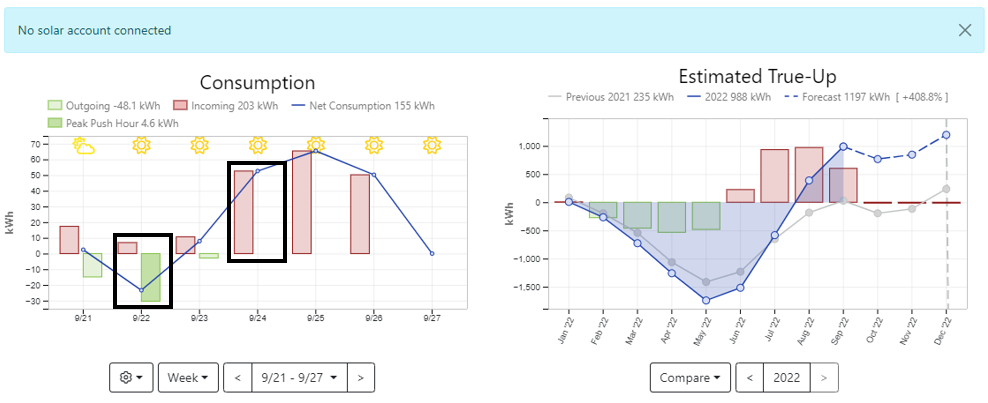
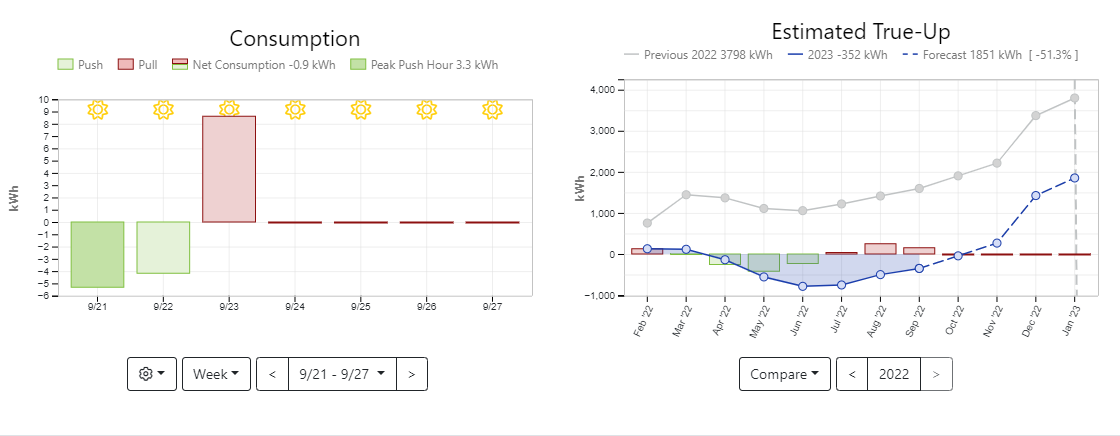
2. The graphs will show both push and pull from the utility separately by day. Note in the example below that there is both a green and red bar for 9/22, but only a red bar for 9/24. Click the red bar (power pulled from utility) on the day with no green bar (power pushed to utility).
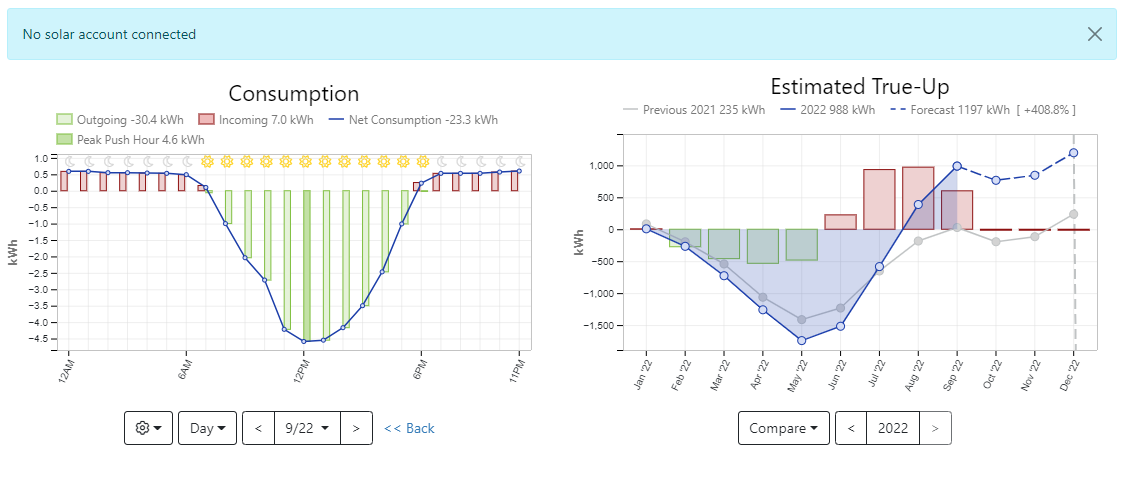
3. This will toggle to the single day view. Here you can see there are no green bars indicating push to the utility during any hour of the day selected. This indicates the solar system is not producing and requires service.
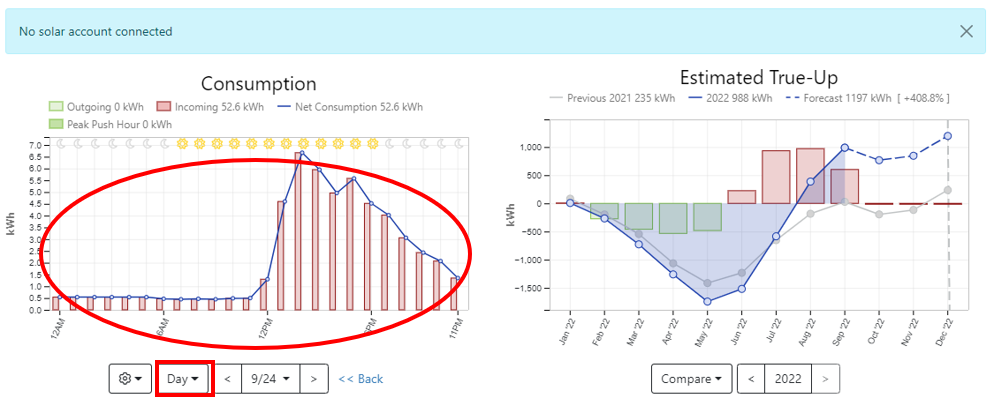
Below is a reference sample of a good day for this customer showing both push to the utility (green bars) and pull from the utility (red bars).
4. Once you have determined the next steps of the issue, it is helpful for your internal tracking purposes to add a note to the system via the "Show Issue" Icon on the report page.
Utility Data Issues
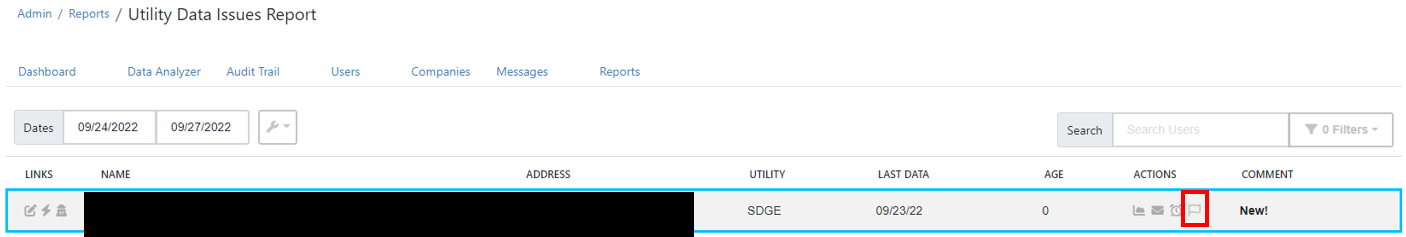
This report will identify systems which are not reporting any consumption data from the utility but do have an active utility data connection. The default view is the last 72 hours, but can be updated by changing the dates in the "Dates" range.
1. Click the "Show Graph" button to view the system graphs
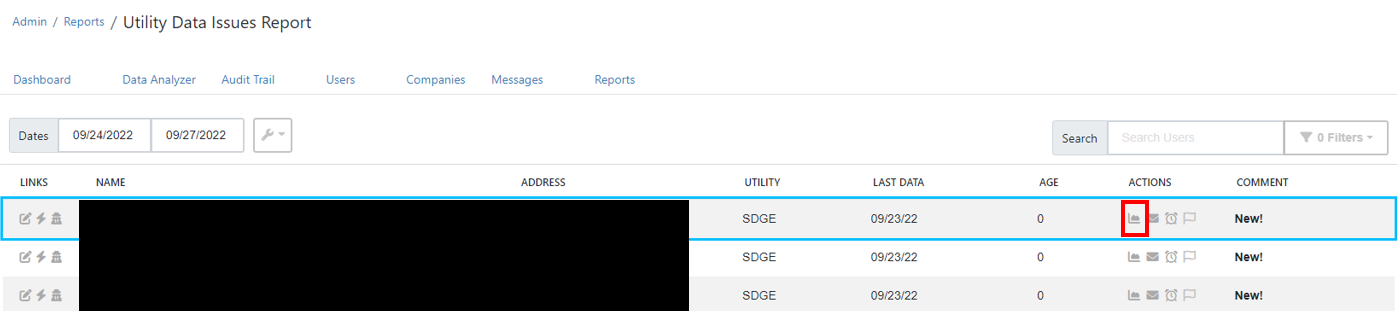
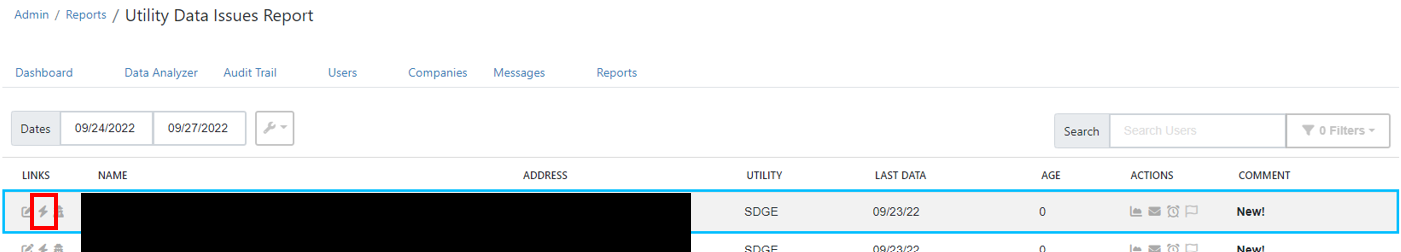
2. In the system below you can see no consumption data has been reported since 9/23.
3. To troubleshoot these types of connection issues, we need to open the Data Analyzer tool using the lightning bolt icon indicated below on the report page.
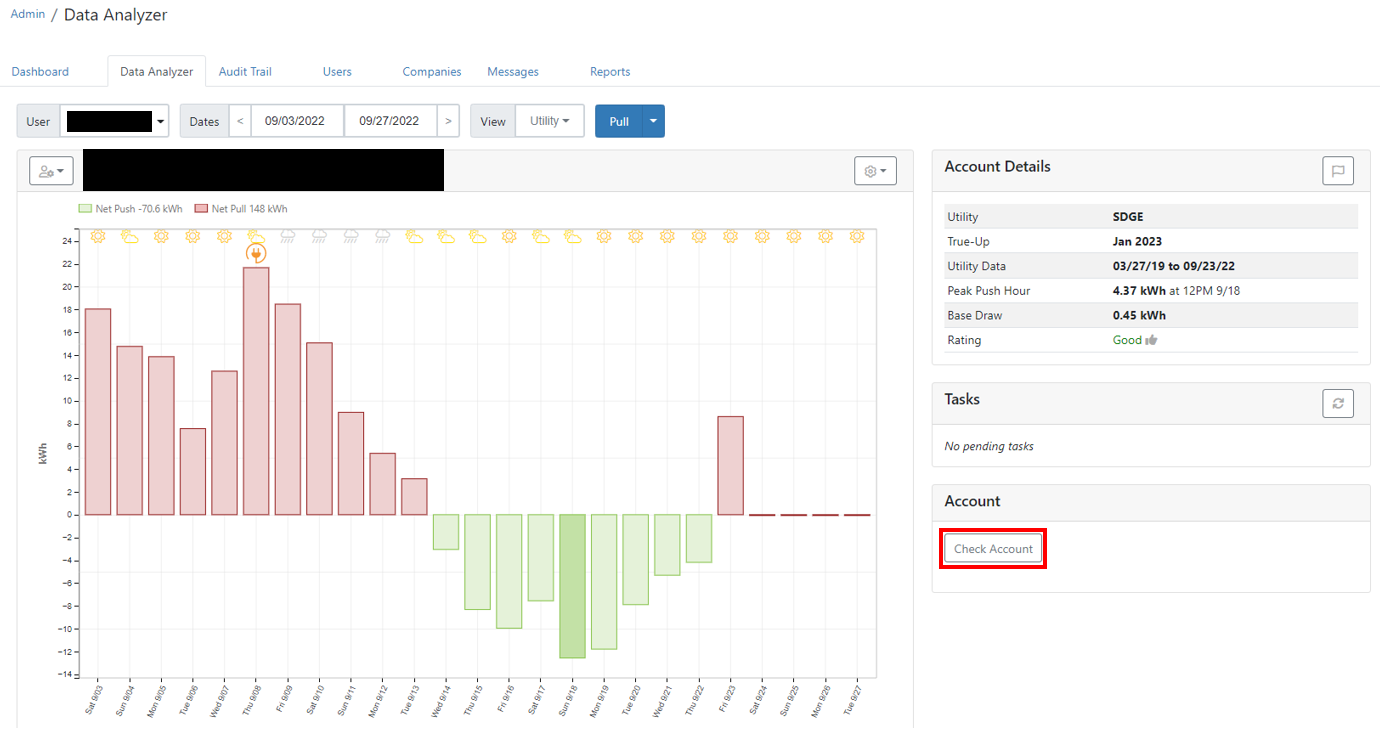
4. Once in the Data Analyzer, the first troubleshooting step is to use the "Check Account" button.
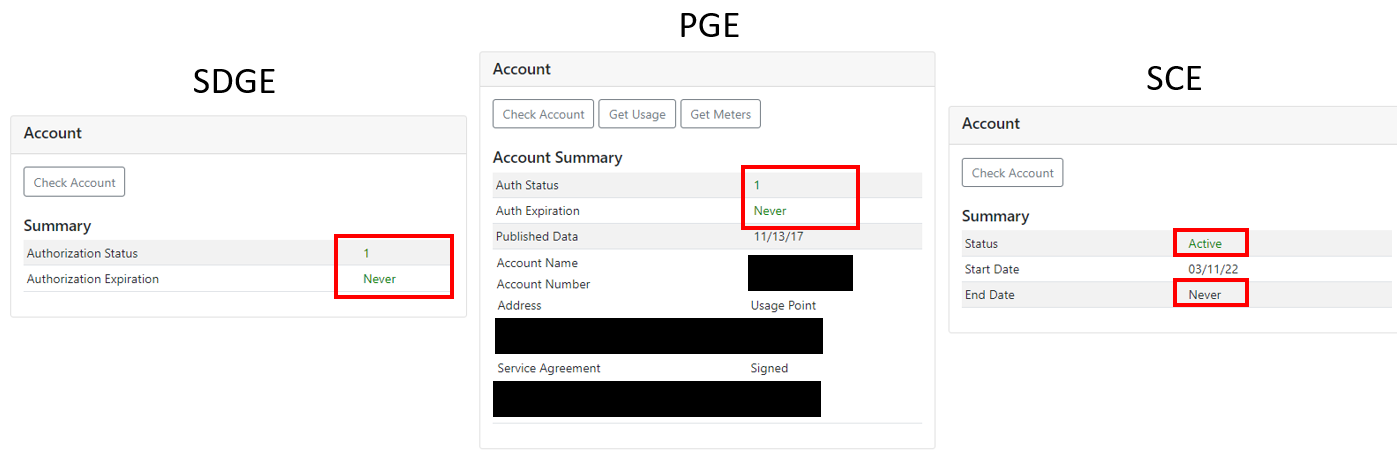
5. Different information will populate depending on which utility your customer is connected to as shown below.
The most important thing to check here is that...
- "Auth Status" or "Status" fields are set to 1/Active which indicates the data connection is active.
- AND that the "Auth Expiration" or "End Date" fields are set to "Never" which indicates the data connection will not expire at a predetermined time.
6. If "Check Account" doesn't show any issues, your next step should be to disconnect/reconnect the utility. If that doesn't resolve the issue, it is likely an issue with the customer's meter and they will need to reach out to their utility to request a repair.
7. Once you have determined the next steps of the issue, it is helpful for your internal tracking purposes to add a note to the system via the "Show Issue" Icon on the report page.