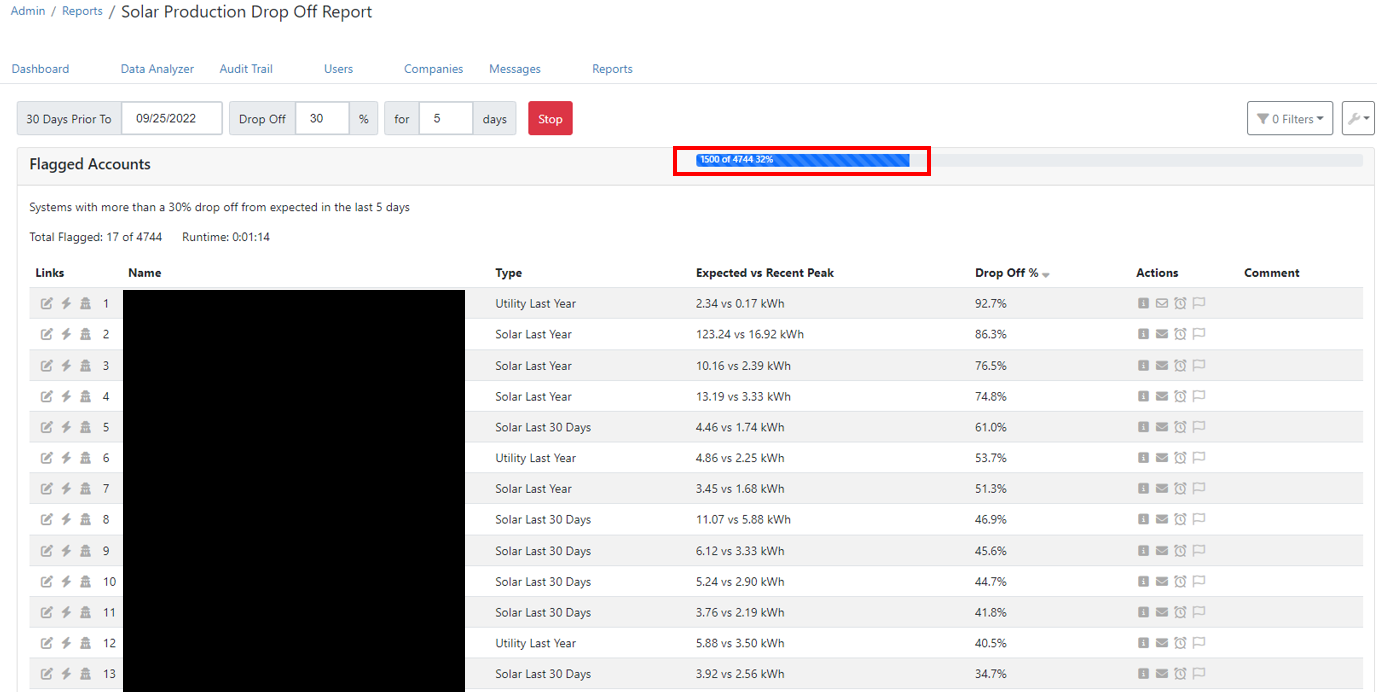
The Solar Production Drop Off Report criteria in green above can be customized based on your specific needs. The default settings are shown above. Once you've customized the report criteria as desired, click "Run Report". When the report begins running, you will see a progress bar as shown below indicating how many systems have been scanned of your entire fleet.
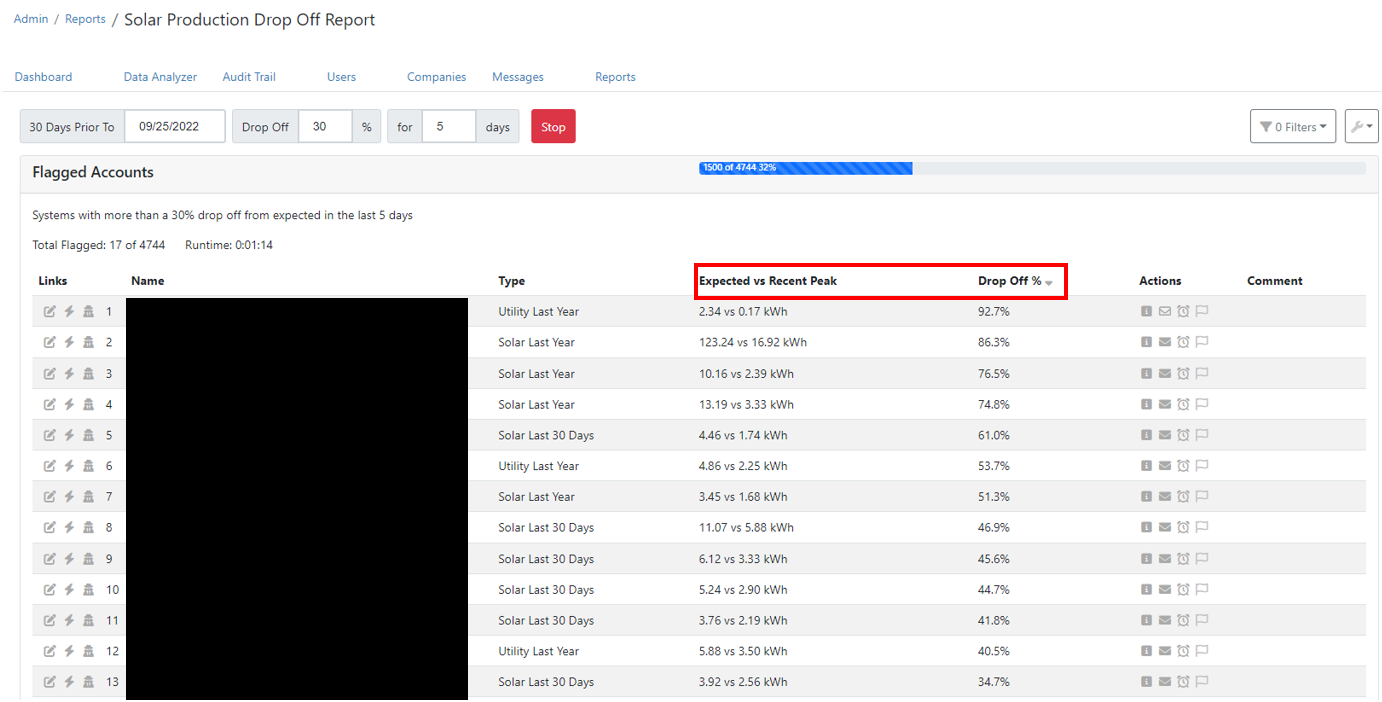
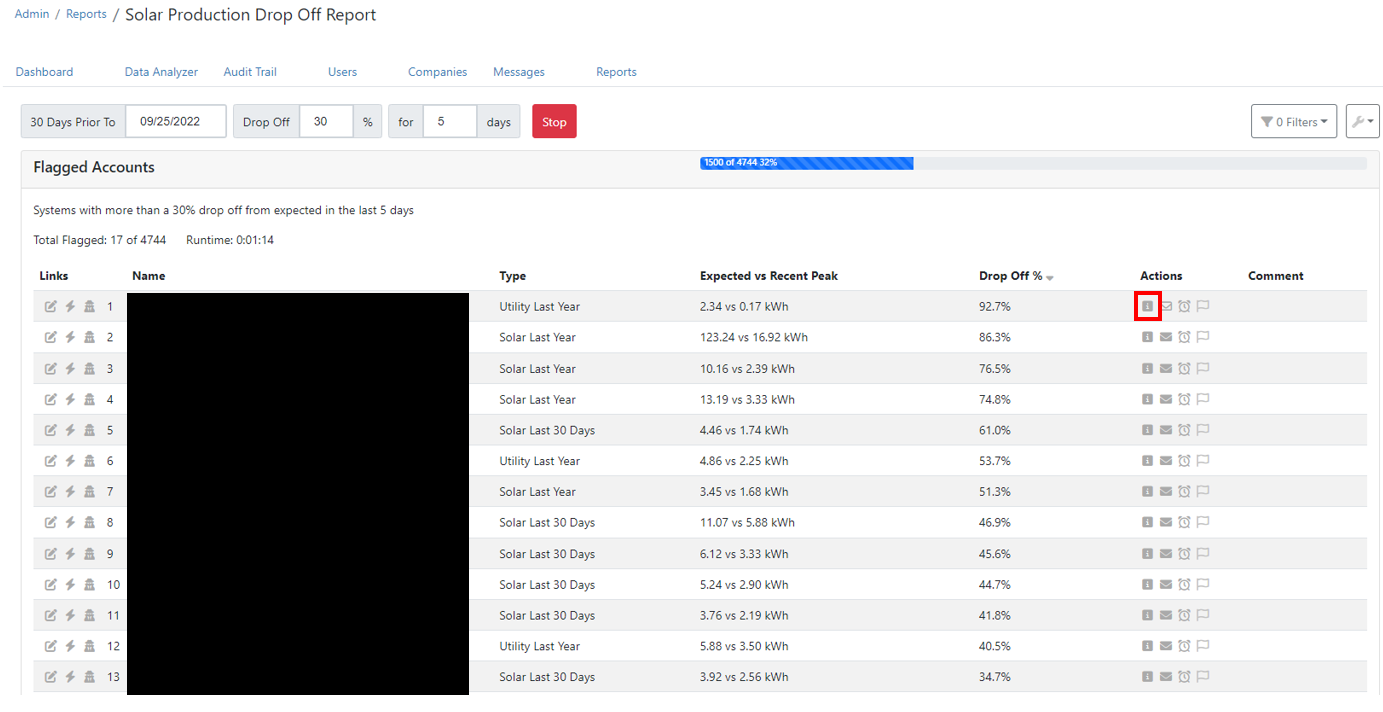
The report will show several items specific to the individual flagged accounts.
- Expected vs. Recent Peak - Indicates the production values that flagged the account.
- Drop Off % - Indicates the percentage drop off for that account. These values should all be greater than your initially selected "Drop Off %" value.
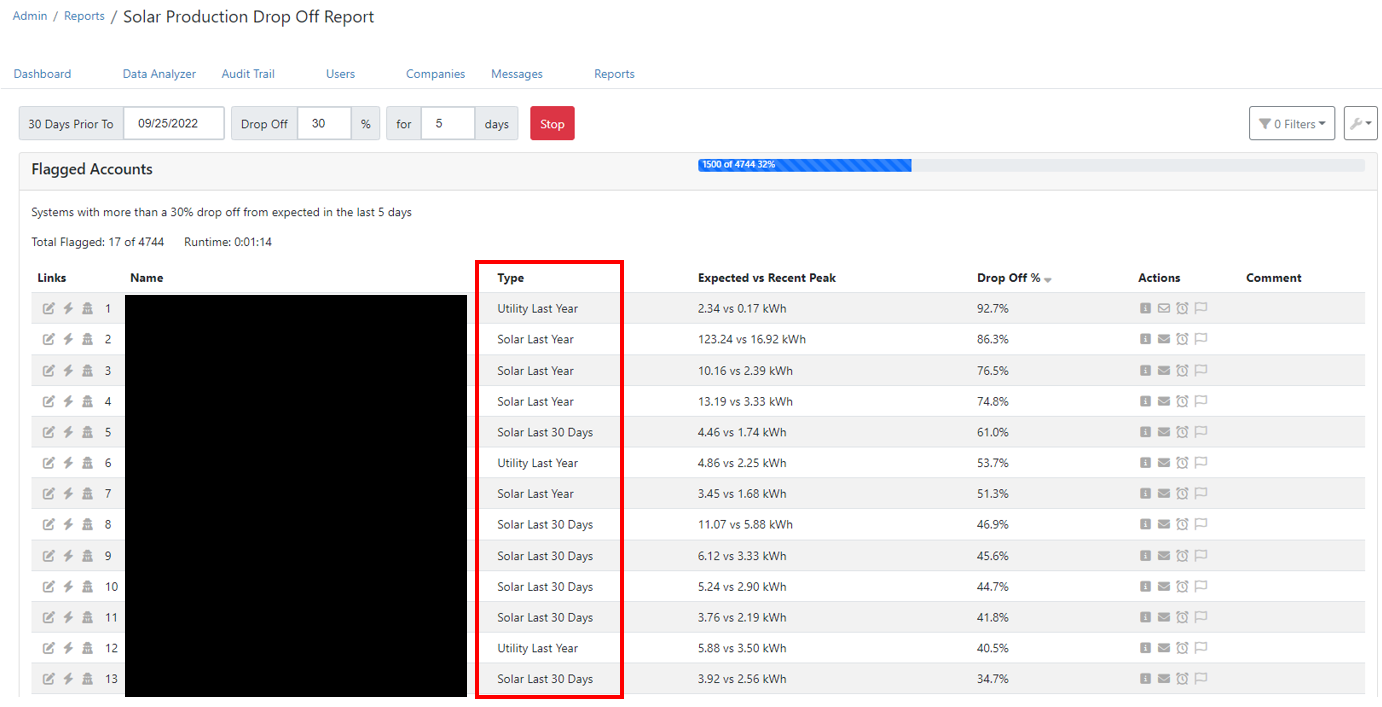
The "Type" Field will indicate one of several statuses indicating what data connection and what time frame was used to flag the issue.
Click the "Show Details" Icon - This is the primary tool you will use to diagnose the issue with a particular account.
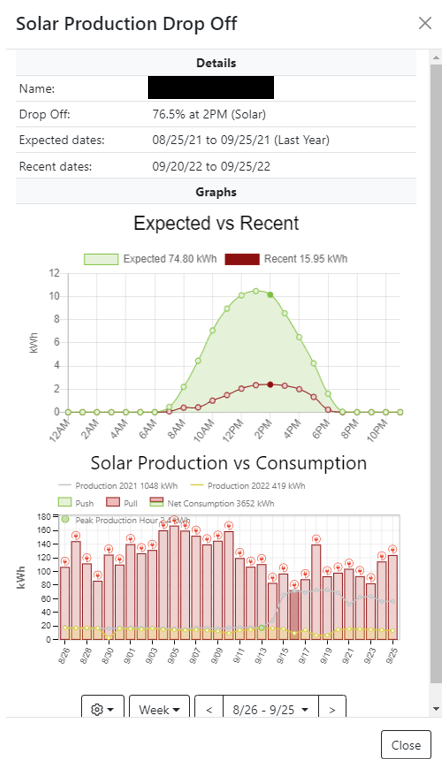
The Show Details icon will bring up the chart below.
- Expected vs Recent Graph - Shows the difference between the Expected Production (Green Area) and the Recent Production (Red Area)
- Solar Production vs. Consumption Graph - Shows the current solar production and consumption over the last 30 days as well as the previous year's production for the same dates.
- Note: If there is no solar inverter data connection, the system will use Estimated Production for these graphs and will indicate "Estimated Solar Production". Estimated solar production is calculated by Know True-Up's algorithm based on the data solely from the utility connection.
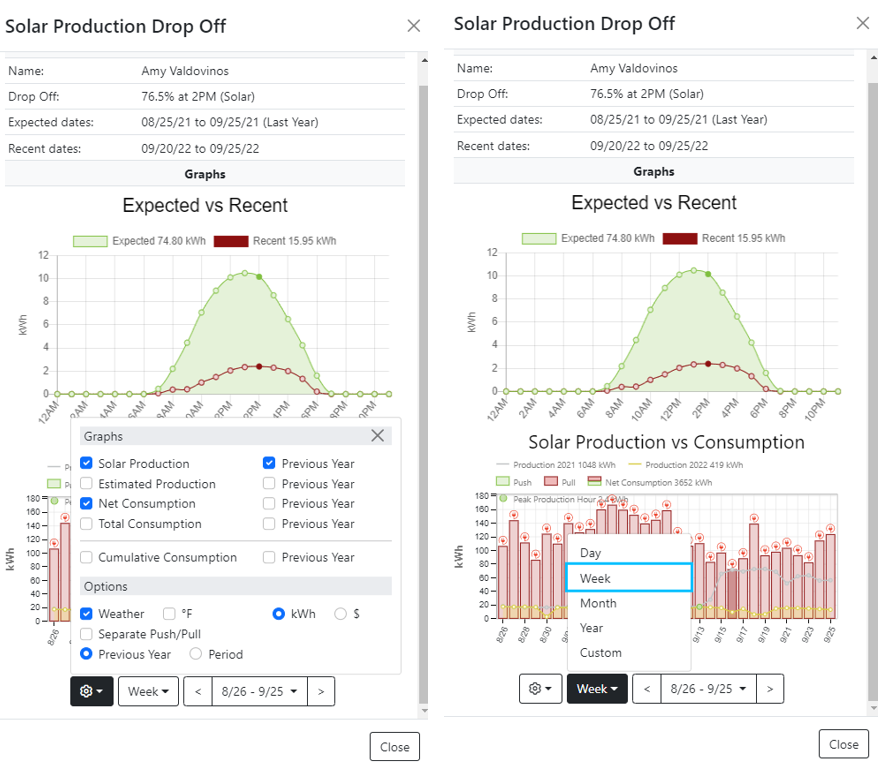
Clicking the "Settings" icon or the "Week" icon will allow you to change the timeframe viewed and items contained in the Solar Production vs. Consumption Graph.
Once you have determined the next steps of the issue, it is helpful for your internal tracking purposes to add a note to the system via the "Show Issue" Icon on the report page.

