To get the most out of this report, it is helpful to have a basic understanding of your customer’s goals for backup power and energy bill savings. This information will allow you to configure the report to identify the best combinations of solar production and energy storage to recommend to your customer.
1. Log into your portal.
In the Reports tab click on “Scenario” in the “Account Reports” section.
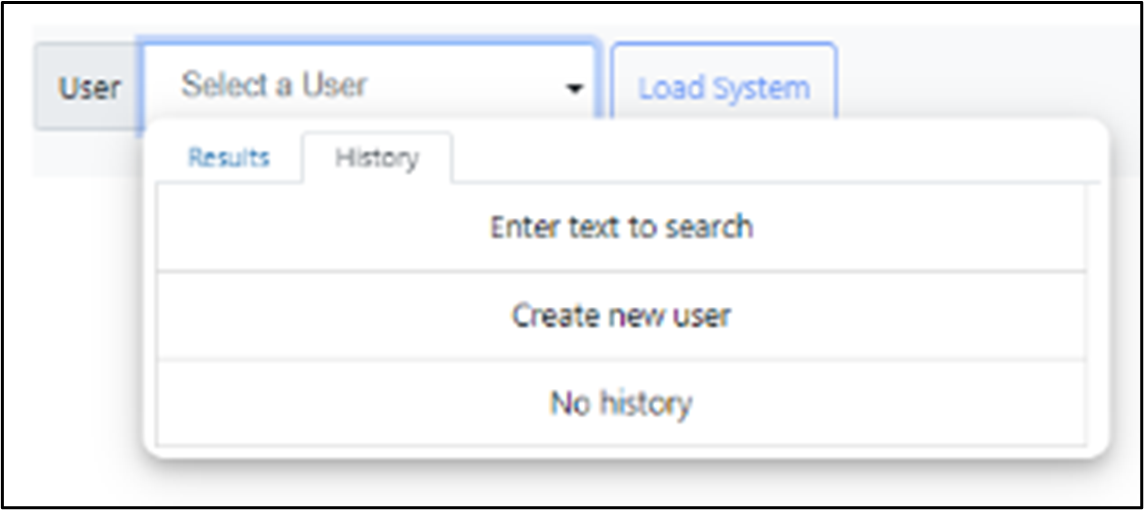
2. To select a user, start typing their name in the “User” field. If your customer is not yet in the system, select, “Create new user”.
NOTE: If your customer is already in the system, select their name and proceed to Step # 5.
3. Clicking “Create new user” will take you to the “Quick Add Customer” page. Enter the customer’s contact information and select “New Lead” as the reason for creating this account.
Leave all the remaining options unchecked.
In the “Send Email to User” field, select the “Sharing Data for Solar / Battery Proposal” email template. You can click “Preview” to see what your customer will receive.
4. Click “Add User”. This will send the email to your customer so that they can authorize the sharing of their utility data.
NOTE: Once your customer completes the data sharing authorization, the utility will begin the process of sending the interval data. Interval data from PG&E and SDG&E will be downloaded immediately. Data from Southern California Edison will take up to 24 hours to arrive.
5. Load Customer Data: Start typing the customer’s name in the “User” field and select them when found.
For “Electricity Usage” select, “Use System Data” to use customer’s interval data from their utility. If the interval data is not yet available select, “Use Sample Profile” and enter the customer’s annual consumption.
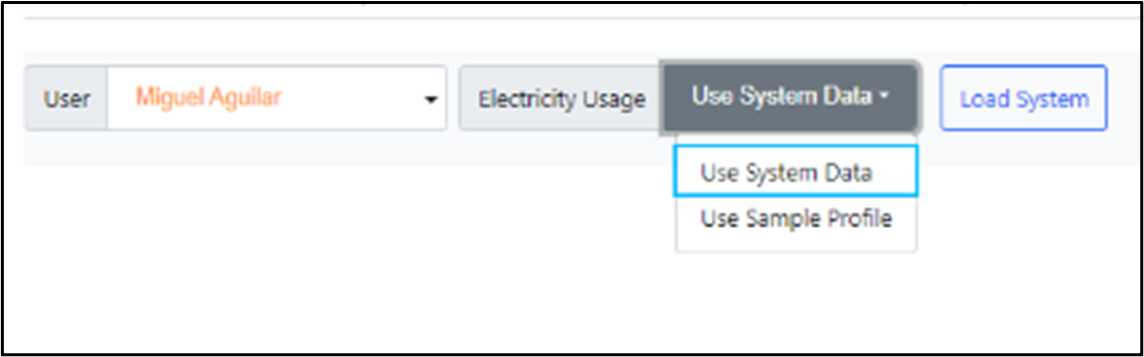 6. Click, “Load System”.
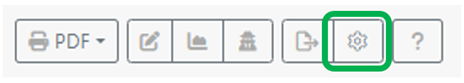
7. Open the "Settings" window by clicking the gear icon at the upper right:
Confirm that the default reports settings match the variables you want to use in your report. You can make "May Defaults" permanent or "Temporary".
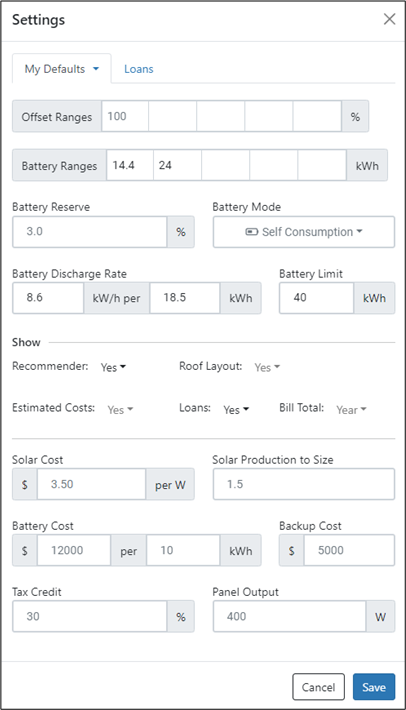
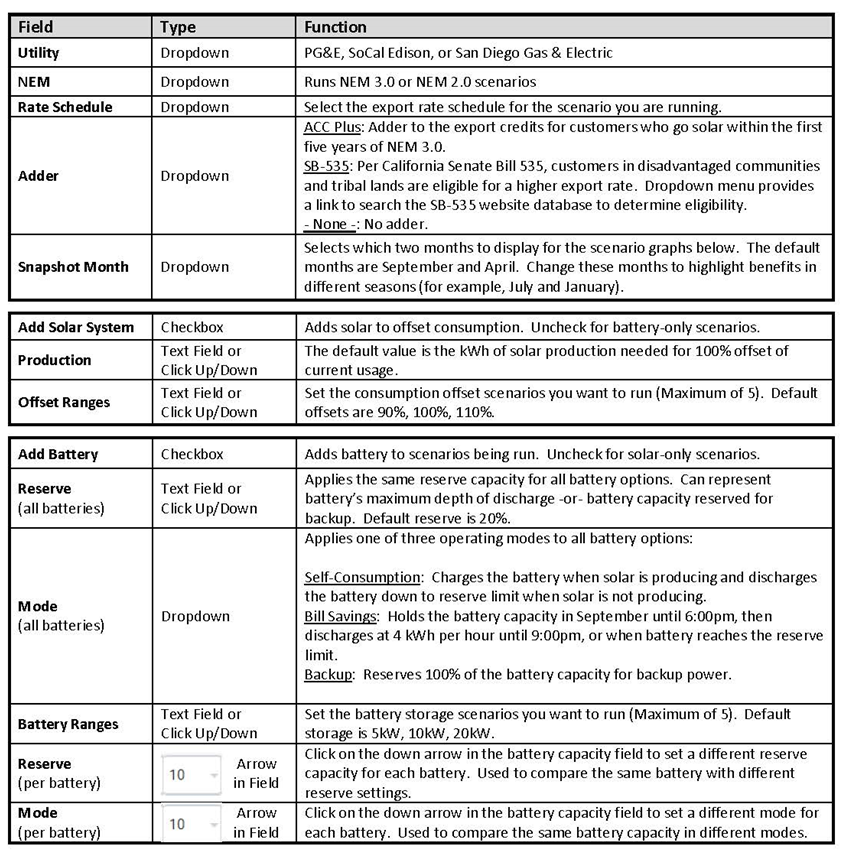
The Scenario Report Settings options are:
|
Offset Ranges: |
Percentage of consumption offset by the solar. Choose up to five. |
|
Battery Ranges: |
kWh capacity of your preferred storage product. Choose up to five. |
|
Battery Reserve: |
Percentage of the battery capacity you want to hold in reserve. |
|
Battery Mode: |
Self-consumption is battery charges when solar is generating and discharges when solar is not generating. |
|
Battery Discharge Rate: |
Maximum continuous discharge rate of the battery. |
|
Battery Limit: |
Maximum amount of storage the report will recommend. |
|
Show Recommender |
Turns on the battery recommender. |
|
Show Estimated Costs: |
Turns on estimated cost in scenario results. |
|
Show Roof Layout: |
Shows the Google Project Sunroof API layout. |
|
Show Loans: |
Turns on loan options. |
|
Show Bill Total: |
Show bill amount per month or per year. |
|
Solar Cost: |
Price per watt for solar. |
|
Solar Production to Size: |
Ratio for estimating solar production. 1000W of solar generates 1500 kWh of energy per year. |
|
Battery Cost |
Price per kWh for battery. |
|
Backup Cost: |
Adder for backup system cost. |
|
Tax Credit: |
Current rate. |
|
Panel Output: |
Wattage per panel. |
8. Modifying Annual Usage: The program will display the user’s trailing 12 months of consumption data and show an estimate of their annual bill. The program uses an average electricity cost of $0.46 / kWh for the estimate.
If your customer’s actual electricity bill over the past twelve months differs significantly from our estimate bill, you can click “Edit” and enter the actual annual bill amount. 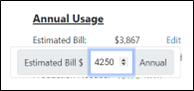
9. Adding Increased Consumption: If your customer is planning to increase their consumption in the future, you can add additional kWh to their annual total. Click “Add” and enter their additional annual consumption. This will also increase the solar production needed to achieve a 100% offset. 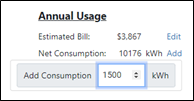
10. Data Entry Points. Review before running scenarios. See explanations below.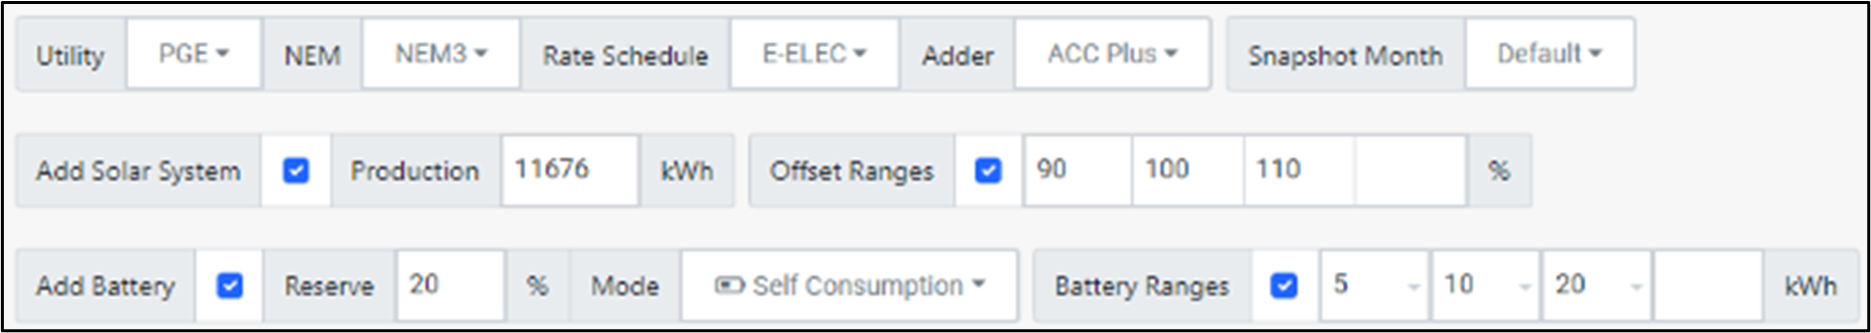
11. Click, “Run Scenarios”
12. Scenario Output Data. Scenario output is sorted by battery capacity, then consumption offset percentage. Data can be re-sorted by any column by clicking the arrows next to the column label. When a scenario row is selected, the graphs below change to reflect the outcomes for that scenario.

Note: When setting a different operating mode level for each battery option, the scenario output will display an icon next to the battery capacity (House Icon = Backup, Battery Icon = Self-Consumption, Coin Icon = Bill Savings).
13. Scenario Graphs. The “September Day Snapshot” and “April Day Snapshot” show the customer’s actual consumption modeled with solar and battery added. Use the picker below each graph to click through different days. To change the snapshot months, select "Snapshot Month" in the data entry points section above and click “Run Scenarios”. 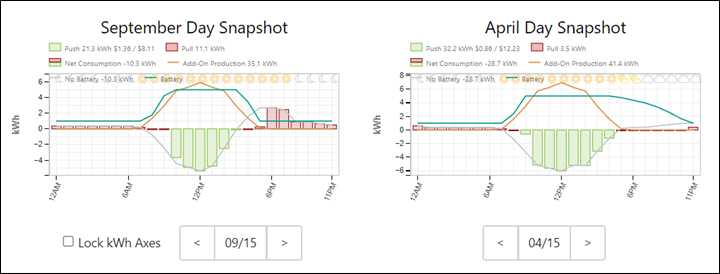
Note: Clicking “Lock kWh Axes” will lock the kWh scale so that it does not change when comparing scenario options.
14. Annual Usage Graph. Shows the customer’s NEM 3.0 energy bill debits and credits over 12-months. Use the picker below the chart to determine the best month for their NEM billing cycle to start.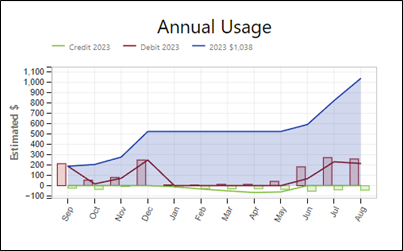
NOTE: The “Annual Usage Graph” shows the customers NBT/NEM3 energy bill debits and credits over 12-months. Use the picker below to determine the best month for their NEM billing cycle to start.
IMPORTANT: Avoid ending the annual billing cycle when the customer has a credit balance. The credits will not carry over!
15. Scenario Details. The Scenario Report will generate an estimate of the project cost using the pricing you entered in the "Settings" section. You can manually override any of the costs. 
16. Removing the Federal Tax Credit: For customers who will not be taking advantage of the Federal ITC, enter “0” in the tax credit field and it will be removed from the calculation. If you delete the “0” you entered, the tax credit will be reapplied to the total project cost.
17. Print your report or convert it to PDF for saving or sending via email.
18. Exporting a CSV File. At the top right of the scenario report page, click on the “Export Interval Data” button.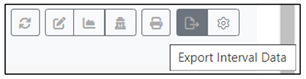
Select the parameters for your CSV File: Date range, file format, and interval frequency.
Click, “Export”.
For information on how to interpret the report data, please visit this article: